Anyhow, the craziness eventually caused a significant correction in Jan'2018. Now after 7 months of wobbling, it regained the uptrend and made new high recently.
Seems like the rally keeps going forever after 9 and half years. Is the rally going to continue? if it is, how long and how high could it go?
As I don't have a "crystal ball" to see the future, so I really don't have answer. But we do see signs of "Rally Fatigue" from some long term signals that only show up when US stock market formed the top. These long term signal may not give us the exact timing of tipping point, but when they persistently diverged with stock market trend, they usually pointed out market direction change in near future. Combined with technical indicators, the market peak could be pinned down.
What Do Long Term Indicators Tell Us
There are a lot of fundamental or long term indicators that give leading signals about economy or stock market. But many times, they generated more false signals than real ones. This doesn't bother anyone who throw out their predictions and I am one of them.I usually look at 3 long term indicators for long term US stock market cycle: CFNAI, ECRI Weekly Leading Indicator(EWLI), and AAII Sentiment (AS). they are leading indicators to US stock market, specifically, S&P500 index, and usually showed certain pattern of divergence, i.e., S&P500 went new high but these indicators didn't.
1. CFNAI: this index usually would "jump" to reached new high(Aug'1998, Dec'2006, and Oct'2017) in the cycle and then formed a divergence with S&P500 as stock market finished the final "Peak Rally". The divergence has been consistent since 1967 when the index started, although the diverge patterns were different over the time and it may give false signals. This is why we need more other factors to confirm.
One more point to CFNAI "jump" before S&P500 final rally, for this cycle, CFNAI's "jump' to new high in Oct'2017 was mostly caused by Tax Cut as it's right around the time when Republican circulated the idea. It's kind like a final push to the top for economy before it jumps off the cliff.

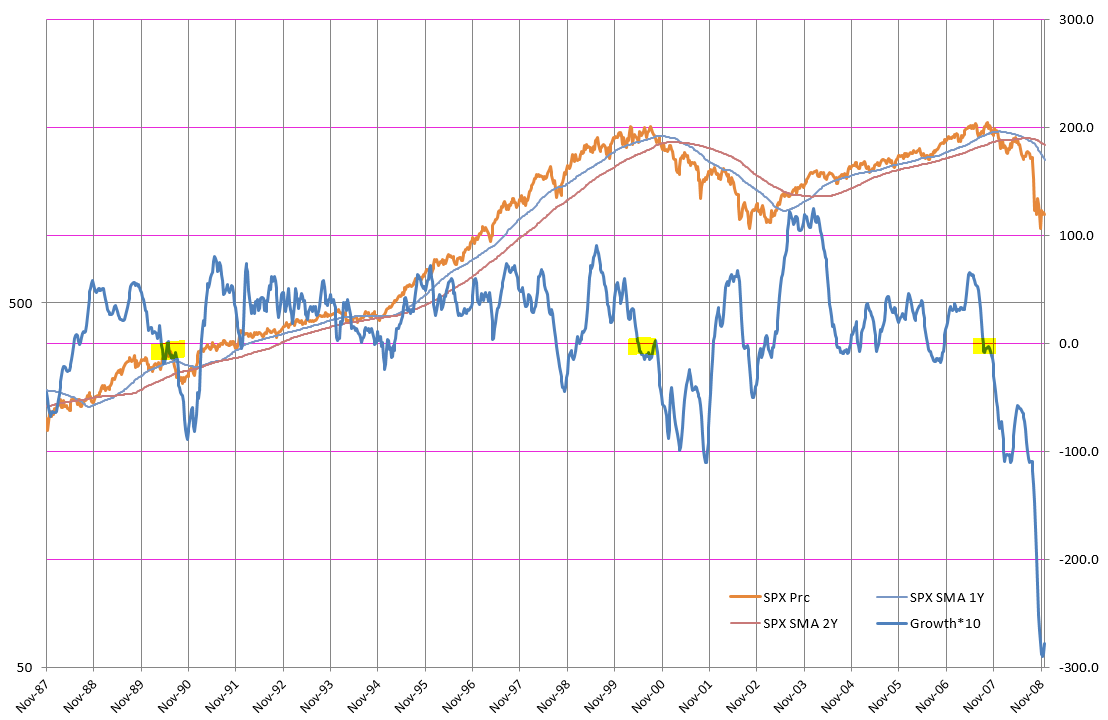
2. EWLI: Growth rate is an interesting indicator. Since 1990, when it moved to below 0 while S&P500 are still rising with new high(yellow highlighted below), it indicated stock market is running above its capacity, so market peak and ensuing recession is coming.
Highlighted areas are EWLI growth diverged with S&P500 in1990, 2000, and 2007

ANS is better to be looked as uncertainty index. In a bull market, Neutral sentiment tends to rise as market goes higher because people feel uncertain when market price goes higher. So when people don't feel much about uncertainty anymore, or people started to feel market direction is more certain, it means the market direction may change. This is exactly what happened when US stock market approached the peak.
The below charts clearly show since 1990, ANS first went lower before S&P500 formed peak. The divergence between S&P500 and ANS could be lasting for long time, so it's hard to use it to pin down exact peak time.
1990 Peak

2000 Peak

2007 Peak

2014-2018

So above 3 long term indicators point out that US stock market is approaching to a major correction or economic recession. The exact S&P500 peak time and height is beyond the perspective of long term indicators, and we will try to use technical analysis on S&P500 price itself to pin down it as we get the big picture.
Technically, When and How High Would S&P500 Peak
Again, timing the market is a daunting task, but constantly many people want to give a try. There are a lot of technical indicators that generate such signals. Many times these are false signals unless fundamental conditions synchronized with them. For timing, I don't have specific prediction, but with above long term indicator pointing out the direction, we may think the upcoming November mid-term election could serve as a trigger for the turning point.
For the height that S&P500 may reach, we can throw out a rough prediction, it's between 2950-3000 and below chart lays out the rationale: from Nov'2016 low 2084 to Jan'2018 high 2873, the correction(2873-2533=340) is slightly over Golden Ratio 38.2% of the rally height (2873-2084=789) as it also need support from 200 day moving average as well. So the next high is to use 50% as split point on correction low 2533 to the new high. 50% is a common ratio for stock market peak, like in 2000, 2007, and 2011.
So I think it will be a repeat of 50% extension pattern for the cycle since Nov'2016. Take the low 2084 in Nov'2016 correction and low 2533 in Feb'2018 correction, the potential peak is 2533+(2533-2084)=2982. Since this is so close to 3000, I guess the market may touch 3000 as a Fake-Break-Through to trap a lot of bulls and finish a spectacular Finale for the long run bull market.

As I stated at the beginning, we see many long term signals that only showed up once every 5-10 years, which is corresponding to the economic cycle, also when multiple signals show up in a synchronized fashion, it add the weight to its significance. So we should take them into account seriously and think about how to allocate investment in near future and preserve our precious asset.
Thanks everyone reading my blog and good luck on your investment!
9/5/2020 Update: it's interesting that I wrote this article two years ago and I called a major correction for US market.
30 days after, a ~20% correction occurred. At that time, I was very naive on market cycle and had fixation on Golden Ratio. Although it's an important technical indicator, but it's really needed to combined with other factors to show a significant power. And the call for SPX 2950 is a little over the actual top 2940, but it's not far off. today, I definitely could do better with more learning from the last two years...