Monday, September 7, 2020

Is US Bull Market Coming to A End?

I didn't update my blog for two years as I went through a broad and deep discovery of fundamental and technical indicators for US stock market cycle. I felt that I need put these indicators into practice for investment/trading to test in real time and avoid 'look back bias'.

I felt lucky that I called out the top of the market in Sep'2018 before the market dropped ~20% in three months. Now with more gained knowledge about the market, I feel more comfortable to call out the market top. This time, the drop is bigger and will last longer, which is considered as the second leg of current recession and the first leg of bear market.

Fundamental Factor Analysis

Fundamentals factors we use here are CPI YOY% and 10-Year Interest Rate. We compared current cycle trend/pattern with historical ones and concluded why it makes sense for ending of the bull market.


Data source: https://fred.stlouisfed.org/series/CPIAUCSL#0

Since CPI YOY% peaked in 1980, it's in a down trend, has finished two economic cycles, and now is in the third one. The first one was in 1980-1991 and the second was in 1992-2008, and the third one started in 2009. If we compare 1992-2008 CPI cycle with current one, we notice many similarities, which could be used to predict possible market direction of current stock market cycle. For instance, in previous two down cycles, each cycle contains four sub-cycles with CPI re-bounces (1980-1991 CPI cycle down trend is so strong that the first two re-bounces were broken into 4 smaller ones in 1981-1983, and the 3rd and 4th ones were obvious). The current CPI cycle is in 3rd sub-cycle and we are at the end of it. The 2nd sub-cycle ending in 2015 was featured with bigger drop of CPI from late 2014 to early 2015, which is same as what happening in current 3rd sub-cycle and CPI big drop was caused by pandemic. When it bounced back, it's associated with strong rally in stock market. 

What happened in second half of 2015 was stock market crashed in August, then Nasdaq 100 reached new high in Nov'2015. After market finished its final rally, SP500 dropped 324 points, ~15%, from its top in May'2015, the biggest points drop since recovery started in Mar'2009. 

What will happen when this rally is over? Unless CPI can continue current re-bounce, which is unlikely as the recession continues, we should see CPI reverts back to down trend and break through the low of -0.2% in 2015. If it happens, it will be very bearish for the market, and it will form the second leg of this recession and a bear stock market. This pattern will be the same CPI pattern in 2002 from last cycle.

Given there were 3 crashes in last 2 years (Jan'2018, Oct'2018, and Feb'2020), the upcoming one will be bigger and last at least 6 months into next year. Different market sections may fare through the down turn quiet differently, like technology stocks from Nasdaq will be stronger than traditional industrial stocks from New York Exchange due to the pandemic economy, and Nasdaq 100 and Composite may not hit new low when the bear market ends.   

The reason I applied 2002 CPI pattern here is because I am a believer that stock market is kind  rhyme or echo the past cycle driven by macro economic factors, like CPI cycle here. It's not the simple repeat as different historical situations modify the details of each cycle, which causes variation. for instance, 1992-2008 CPI cycle is disinflation, marked by declining positive CPI YOY%. Current CPI cycle started in 2009 is a true deflation cycle with declining CPI YOY% and also trenched with negative CPI YOY%.    

If we examine 10-Year Treasury Rate (TNX), we can find that it follows the similar down trend pattern as CPI YOY%. It makes sense as long term interest rate is the reflection of inflation along with embedded real interest rate. We can identify stock market cycle from 1990 to 2002 was associated with three TNX down waves (1990-1993, 1995-1998, and 2000-2003). TNX three waves down trend pattern (2010-2012, 2014-2016, and 2019-?) also showed up in current stock market cycle. If we assume TNX current down trend will last as prior one, it should extend to 2021. As the pandemic triggered TNX down trend pushed up stock market to new high, the next leg of TNX down trend would be stock bear market along with the continuing recession.

Technical Factor Analysis

SPX and other indices, like Nasdaq Composite (COMPQ), Nasdaq 100 (NDX) and New York Exchange Composite (NYA), are approaching important cycle timeline. Overall, these market indices have 6-8 months mid-term cycle, and when the cycle reach three, they form a complete long term cycle, which means a bigger correction is needed. If index price cycle matches the timeline of fundamental factors cycle, like CPI, it could mean the end of the market trend. 

The below two years SPX chart shows that it had two cycles by Feb'2020, 7 and 6.5 months, respectively. this means current third cycle would last 6 months, and end on 9/23/2020. We should be very careful around this date and check out if the peak could be confirmed by other technical indicators. 


One last technical and psychological indicator is AAII sentiment, and we noticed that the Neutral dropped to a new low since 2011 in March due to pandemic and Bearish is hovering around 40-50%, the highest since 2014. If the Neutral can't improve and break up through previous cycle high of 46.31 in Apr'2019, the bull market since 2009 will be ended. I mentioned in my last post about how bull markets in the past peaked with the Neutral signal, and now this signal is strong and clear.


Data source: https://www.aaii.com/sentimentsurvey 

An extension of this discussion is how next economic cycle looks like after this recession ends. I think it will be a major inflation cycle with CPI YOY% and TNX on an uptrend, like what happened from 2003 to 2008. But we need to preserve our capital and wait for the bear market storm to pass...




Monday, September 3, 2018

Is US Stock Market Reaching A Tipping Point?

Since US Election in Nov'2016, US and other stock markets across the world experienced a high fly. Part of the rally may resulted from economic cycle itself, which means no matter who was elected, the rally is inevitable, and the Election is just a trigger; another part may come from new policies, like tax cut, and it added some craziness to the rally, which is hard to evaluate the long term effect to the market or economy so far.
Anyhow, the craziness eventually caused a significant correction in Jan'2018. Now after 7 months of wobbling, it regained the uptrend and made new high recently.
Seems like the rally keeps going forever after 9 and half years. Is the rally going to continue? if it is, how long and how high could it go?
As I don't have a "crystal ball" to see the future, so I really don't have answer. But we do see signs of "Rally Fatigue" from some long term signals that only show up when US stock market formed the top. These long term signal may not give us the exact timing of tipping point,  but when they persistently diverged with stock market trend, they usually pointed out market direction change in near future. Combined with technical indicators, the market peak could be pinned down.
What Do Long Term Indicators Tell Us
There are a lot of fundamental or long term indicators that give leading signals about economy or stock market. But many times, they generated more false signals than real ones. This doesn't bother anyone who throw out their predictions and I am one of them.
I usually look at 3 long term indicators for long term US stock market cycle: CFNAI, ECRI Weekly Leading Indicator(EWLI), and AAII Sentiment (AS). they are leading indicators to US stock market, specifically, S&P500 index, and usually showed certain pattern of divergence, i.e., S&P500 went new high but these indicators didn't.

1. CFNAI: this index usually would "jump" to reached new high(Aug'1998, Dec'2006, and Oct'2017) in the cycle and then formed a divergence with S&P500 as stock market finished the final "Peak Rally". The divergence has been consistent since 1967 when the index started, although the diverge patterns were different over the time and it may give false signals. This is why we need more other factors to confirm.
One more point to CFNAI "jump" before S&P500 final rally, for this cycle, CFNAI's "jump' to new high in Oct'2017 was mostly caused by Tax Cut as it's right around the time when Republican circulated the idea. It's kind like a final push to the top for economy before it jumps off the cliff.
Data source: https://www.chicagofed.org/research/data/cfnai/current-data

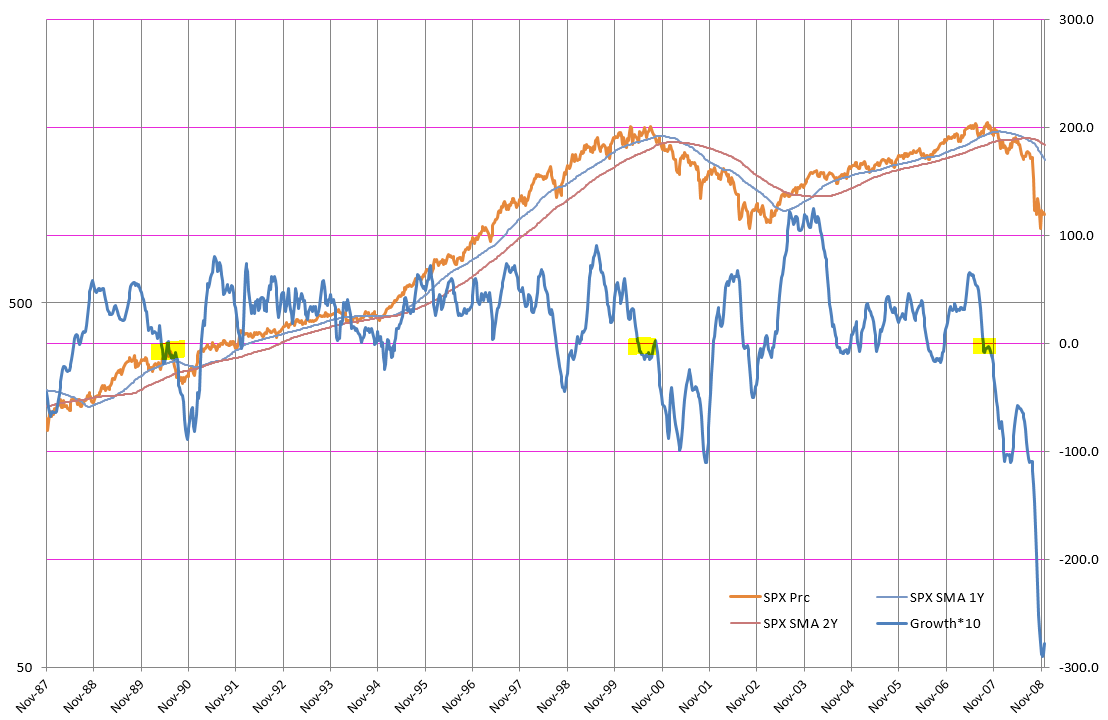
2. EWLI: Growth rate is an interesting indicator. Since 1990, when it moved to below 0 while S&P500 are still rising with new high(yellow highlighted below), it indicated stock market is running above its capacity, so market peak and ensuing recession is coming.
Highlighted areas are EWLI growth diverged with S&P500 in1990, 2000, and 2007
EWLI Growth(EWLIG) tanked into negative last week. From Apr'2010 and Oct'2014 pattern, we know when EWLIG dove into negative, a US stock market major correct would follow. If S&P500 led, the correction could be big, like Aug'2015-Feb'2016 major correction.
Data source: https://www.businesscycle.com/ecri-reports-indexes/all-indexes

 3. AAII Neutral Sentiment(ANS): many people look at the bull/bear sentiment, but I like ANS as there's unique information not captured by Bull/Bear sentiment.
ANS is better to be looked as uncertainty index. In a bull market, Neutral sentiment tends to rise as market goes higher because people feel uncertain when market price goes higher. So when people don't feel much about uncertainty anymore, or people started to feel market direction is more certain, it means the market direction may change. This is exactly what happened when US stock market approached the peak.
The below charts clearly show since 1990, ANS first went lower before S&P500 formed peak. The divergence between S&P500 and ANS could be lasting for long time, so it's hard to use it to pin down exact peak time.

1990 Peak


2000 Peak 


2007 Peak
2014-2018


data source: https://www.aaii.com/sentimentsurvey

So above 3 long term indicators point out that US stock market is approaching to a major correction or economic recession. The exact S&P500 peak time and height is beyond the perspective of long term indicators, and we will try to use technical analysis on S&P500 price itself to pin down it as we get the big picture.


Technically, When and How High Would S&P500 Peak
Again, timing the market is a daunting task, but constantly many people want to give a try. There are a lot of technical indicators that generate such signals. Many times these are false signals unless fundamental conditions synchronized with them. 
For timing, I don't have specific prediction, but with above long term indicator pointing out the direction, we may think the upcoming November mid-term election could serve as a trigger for the turning point.
For the height that S&P500 may reach, we can throw out a rough prediction, it's between 2950-3000 and below chart lays out the rationale: from Nov'2016 low 2084 to Jan'2018 high 2873, the correction(2873-2533=340) is slightly over Golden Ratio 38.2% of the rally height (2873-2084=789) as it also need support from 200 day moving average as well. So the next high is to use 50% as split point on correction low 2533 to the new high. 50% is a common ratio for stock market peak, like in 2000, 2007, and 2011.
So I think it will be a repeat of 50% extension pattern for the cycle since Nov'2016. Take the low 2084 in Nov'2016 correction and low 2533 in Feb'2018 correction, the potential peak is 2533+(2533-2084)=2982. Since this is so close to 3000, I guess the market may touch 3000 as a Fake-Break-Through to trap a lot of bulls and finish a spectacular Finale for the long run bull market.
Data source: https://stockcharts.com

As I stated at the beginning, we see many long term signals that only showed up once every 5-10 years, which is corresponding to the economic cycle, also when multiple signals show up in a synchronized fashion, it add the weight to its significance. So we should take them into account seriously and think about how to allocate investment in near future and preserve our precious asset.
Thanks everyone reading my blog and good luck on your investment!
9/5/2020 Update: it's interesting that I wrote this article two years ago and I called a major correction for US market. 
30 days after, a ~20% correction occurred. At that time, I was very naive on market cycle and had fixation on Golden Ratio. Although it's an important technical indicator, but it's really needed to combined with other factors to show a significant power. And the call for SPX 2950 is a little over the actual top 2940, but it's not far off. today, I definitely could do better with more learning from the last two years...   


Saturday, May 23, 2015

Interesting Sentiment Readings About US Bull Market - Web Links

As I read through some materials cross websites and it confirms my view about current market status, the US bull market still has long way to go:

Unusually High Neutral Sentiment Often Followed by Good Returns -AAII
Birinyi Says Six-Year Bull Won’t End Until Skeptics Muzzled  
My take away is Skeptics=Neutral Sentiment
Confirmation bias? It could be...

Sunday, May 10, 2015

Riding Chinese Bull Market with Golden Ratio (Continued)

As we mentioned last time, we threw out 12K as our optimistic estimation of  SSEC peak. The estimation is based on SSEC historical path and golden ratios it has followed. For instance, 261.8% expansion is the most important Golden Ratio for SSEC bull market. This ratio has showed up in 1992, 1996, and 2005 bull market (Figure. 1 - 3).


                  Figure.1 Bull market in 1992-1993 with Golden Expansion Ratio 261.8%

              Figure.2 Bull market in 1996-1997 with Golden Expansion Ratio 261.8%

                    Figure.3 Bull market in 2005-2007 with Golden Expansion Ratio 261.8%
Of course the path of current bull market is unfolding and based on latest reading, the final peak of the market is standing at about 6,000.

                   Figure.4 Current bull market with Golden Expansion Ratio 261.8% to 6000
This is not to say 12K is not reachable: if the market can breakthrough 6K with high volume, it will set the path for 12K.

Since March 2015 market breakthrough, this wave point out a short term peak at 5K in next 1-2 months. Depending how the volume looks like, i.e, historical high volume is needed to breakthrough, we expect a major correct there.

Also, global market is headed to a major correction in next 1-2 months (we will talk about this in details in near future before the correction), so Chinese market may not immune from the "global pandemic".

Sunday, April 26, 2015

Riding Chinese Bull Market with Golden Ratio

Chinese stock market right now is so hot that it's everybody's guess where's the possible height it will reach. I would like to join this "exuberance" and try to rationally guess where Shanghai Stock Exchange Composite(SSEC) will end up.
My guesstimation to the peak of SSEC is about 12,000 in 2017.
I will get more details later...